10 Chart from Bongland - of %of 2nd dose recvd by age cohort (media.communities.win) posted 4 years ago by the-new-style 4 years ago by the-new-style +10 / -0 4 comments download share 4 comments share download save hide report block hide replies
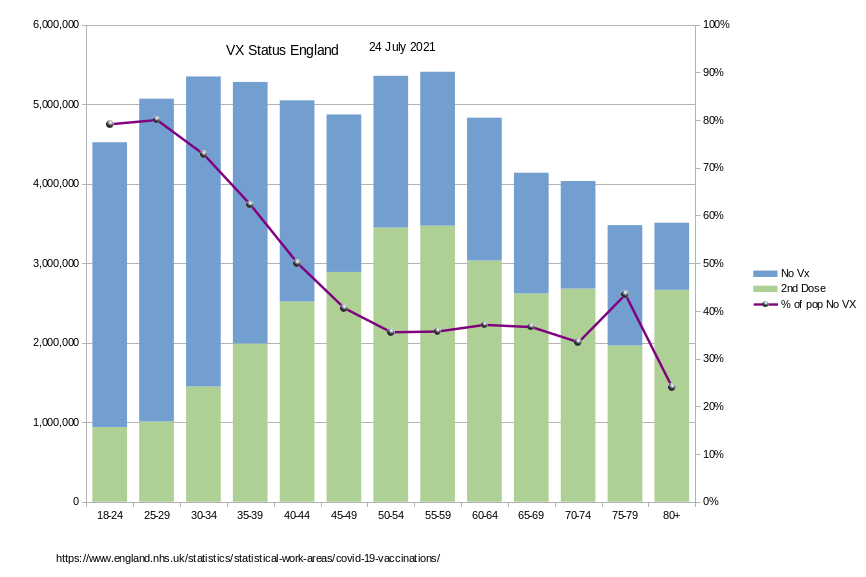
I made the chart from the following data
Vx Data
https://www.england.nhs.uk/statistics/statistical-work-areas/covid-19-vaccinations/
Population: https://www.ons.gov.uk/peoplepopulationandcommunity/populationandmigration/populationestimates/bulletins/annualmidyearpopulationestimates/mid2019estimates
the population estimates are pre pandemic, that might explain the spike in the 75-79 cohort - the no VX might all be dead !